Case Study

SolarPulse — Renewable Energy Monitoring Dashboard

SolarPulse is an intelligent energy management platform designed to simplify the monitoring and optimization of solar infrastructure. The platform provides operators, businesses, and energy providers with real-time visibility into energy production, system health, environmental impact, and operational performance.

Dashboard

UI/UX Design

SaaS Platform

Clean Energy

NexPay

Case Study

SolarPulse — Renewable Energy Monitoring Dashboard

SolarPulse is an intelligent energy management platform designed to simplify the monitoring and optimization of solar infrastructure. The platform provides operators, businesses, and energy providers with real-time visibility into energy production, system health, environmental impact, and operational performance.

Dashboard

UI/UX Design

SaaS Platform

Clean Energy

NexPay

Case Study

SolarPulse — Renewable Energy Monitoring Dashboard

SolarPulse is an intelligent energy management platform designed to simplify the monitoring and optimization of solar infrastructure. The platform provides operators, businesses, and energy providers with real-time visibility into energy production, system health, environmental impact, and operational performance.

Dashboard

UI/UX Design

SaaS Platform

Clean Energy

NexPay

Client

Client

Hank Hess

Hank Hess

Hank Hess

Project Duration

Project Duration

Project Duration

2 Month

2 Month

2 Month

Country

Country

United States

United States

Platform

Platform

Figma

Figma

About the brand

SolarPulse is a renewable energy technology platform focused on helping organizations maximize the efficiency of their solar investments. By combining real-time monitoring, analytics, and performance tracking, the platform empowers users to understand exactly how their energy systems are performing.

Challenges & Solutions

Problems

Managing solar infrastructure often requires monitoring large amounts of technical information across multiple sites, devices, and performance metrics. Existing solutions frequently overwhelm users with complex interfaces and difficult-to-understand reporting systems.

Managing solar infrastructure often requires monitoring large amounts of technical information across multiple sites, devices, and performance metrics. Existing solutions frequently overwhelm users with complex interfaces and difficult-to-understand reporting systems.

What we did

We designed a data-first dashboard experience focused on clarity, accessibility, and efficiency. Information architecture was carefully structured to surface the most important insights first, allowing users to quickly understand performance, energy generation, and system health.

We designed a data-first dashboard experience focused on clarity, accessibility, and efficiency. Information architecture was carefully structured to surface the most important insights first, allowing users to quickly understand performance, energy generation, and system health.

Sitemap

The homepage experience guides visitors through a strategic narrative that moves from awareness to consideration. Product features, AI-powered capabilities, pricing models, educational content, testimonials, and FAQs are presented through engaging sections that make complex financial concepts easy to understand.

Website Design

Custom charts, monitoring widgets, environmental impact tracking, and real-time reporting modules were designed to transform complex datasets into actionable insights. The final platform provides a seamless experience for monitoring, analyzing, and managing solar operations at scale.

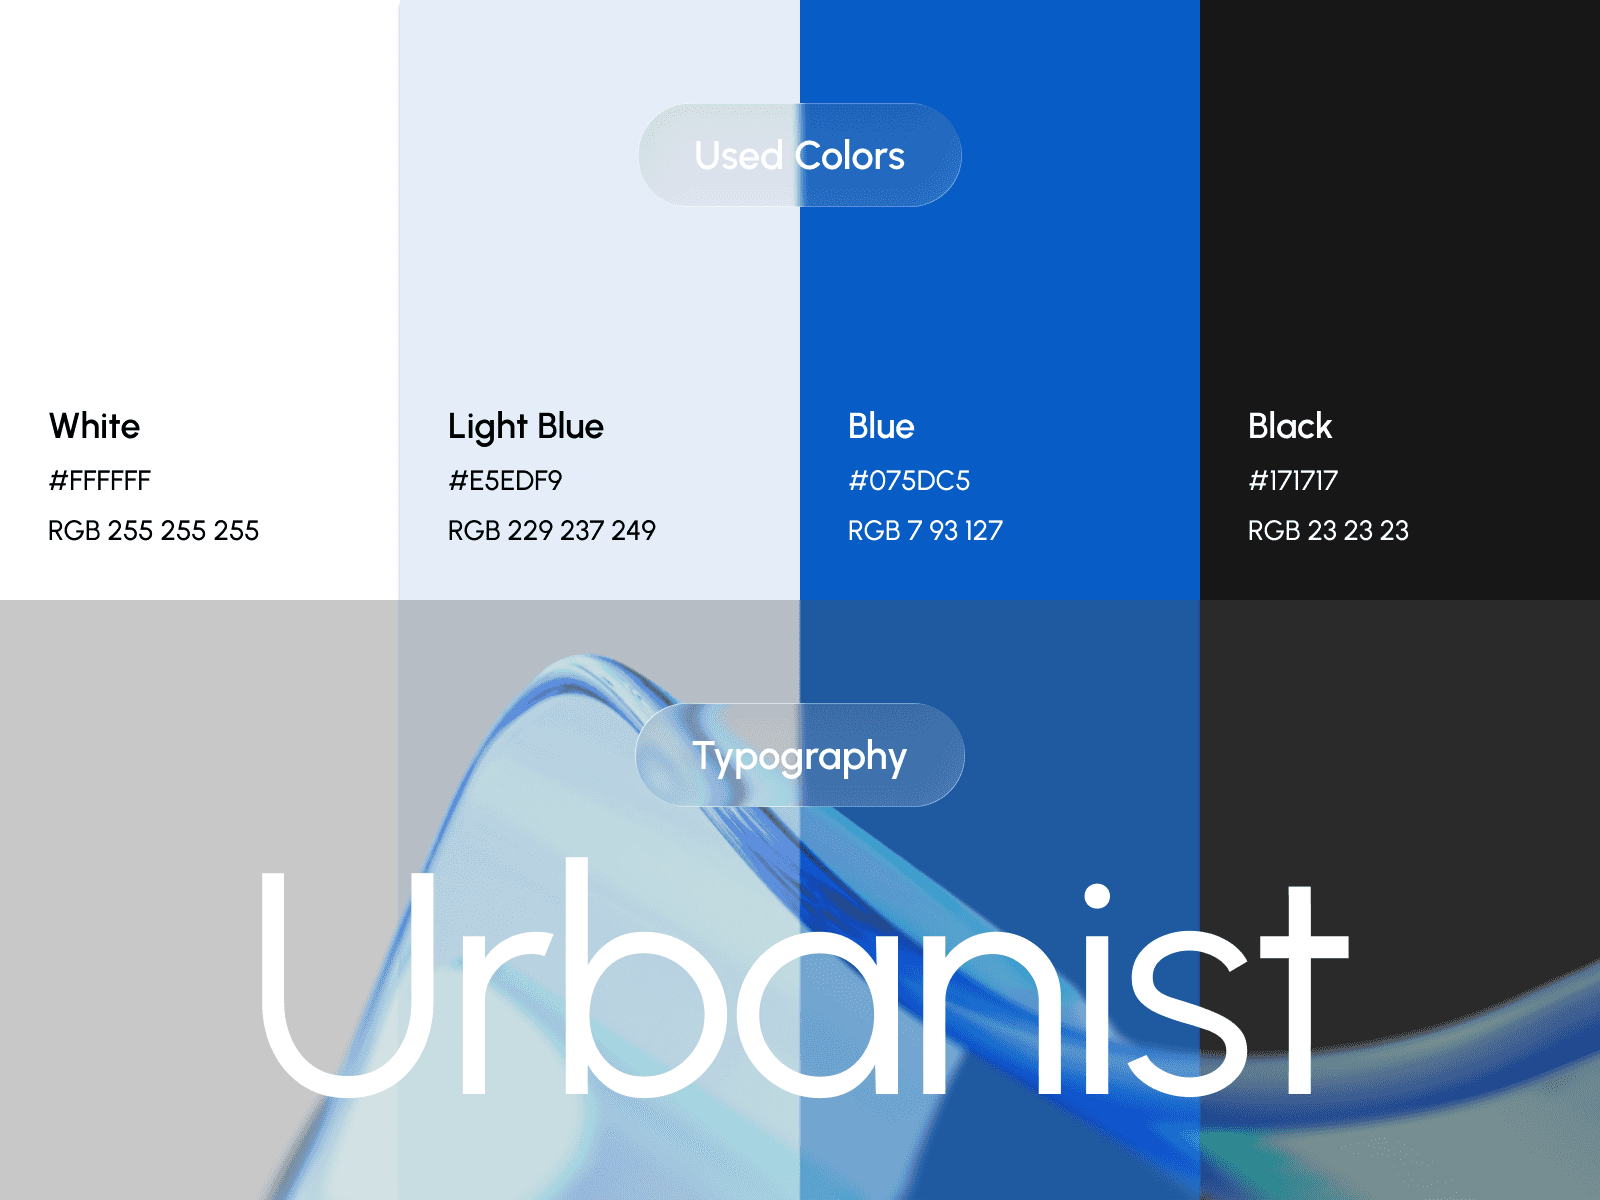
Colors & Typography
Results

16+

Active Sites Managed

Designed a centralized dashboard experience capable of monitoring and managing multiple solar installations from a single interface.

5.62 MW

Live Power Monitoring

Real-time energy tracking enables operators to monitor system performance, production levels, and operational efficiency instantly.

92%

System Availability

Built intuitive monitoring tools that help identify issues faster and maintain optimal system performance across energy networks.

100%

Responsive Experience

Designed and developed a seamless dashboard experience optimized for desktop, tablet, and modern device environments.

16+

Active Sites Managed

Designed a centralized dashboard experience capable of monitoring and managing multiple solar installations from a single interface.

92%

System Availability

Built intuitive monitoring tools that help identify issues faster and maintain optimal system performance across energy networks.

5.62 MW

Live Power Monitoring

Real-time energy tracking enables operators to monitor system performance, production levels, and operational efficiency instantly.

100%

Responsive Experience

Designed and developed a seamless dashboard experience optimized for desktop, tablet, and modern device environments.

Our Schedule

Choose a time that suits you and schedule.

See how we’ve helped clients turn ambitious ideas into impactful digital products.

Have a bold idea?Let’s bring it to life.

Have a bold idea?
Let’s bring it to life.

Clients trust us

5.0

Based on 24 Clutch Reviews

© 2026 Nexila, All rights reserved

Nexila

© 2026 Nexila, All rights reserved

Nexila

© 2026 Nexila, All rights reserved

Nexila

© 2026 Nexila, All rights reserved

Nexila

© 2026 Nexila, All rights reserved

Nexila